Exploring the Power of Streamlit: A Comprehensive Guide
Streamlit is a powerful Python library that allows for the creation of interactive web applications for data science and machine learning projects. With Streamlit, developers can easily build and deploy applications without the need for extensive web development knowledge. Streamlit simplifies the process of developing data-driven applications by providing a user-friendly interface and a range of pre-built components.
Key Features of Streamlit
- Easy-to-use interface
- Interactive widgets for data visualization
- Built-in support for popular data science libraries like Pandas and Matplotlib
- Automatic hot reloading for instant updates
- Seamless deployment options
Getting Started with Streamlit
To start using Streamlit, you first need to install the library using pip:
$ pip install streamlit
Once installed, you can create a new Streamlit application by writing a Python script and running it using the following command:
$ streamlit run main.py
Creating a Simple Streamlit App
Let's create a basic Streamlit app that displays a scatter plot using Matplotlib:
import streamlit as st
import numpy as np
import matplotlib.pyplot as plt

st.title('Streamlit Scatter Plot Example')

# Generate random data
data = np.random.randn(100, 2)

fig, ax = plt.subplots()

# Create scatter plot
ax.scatter([1, 2, 3], [1, 2, 3])

#Print plot
st.pyplot(fig)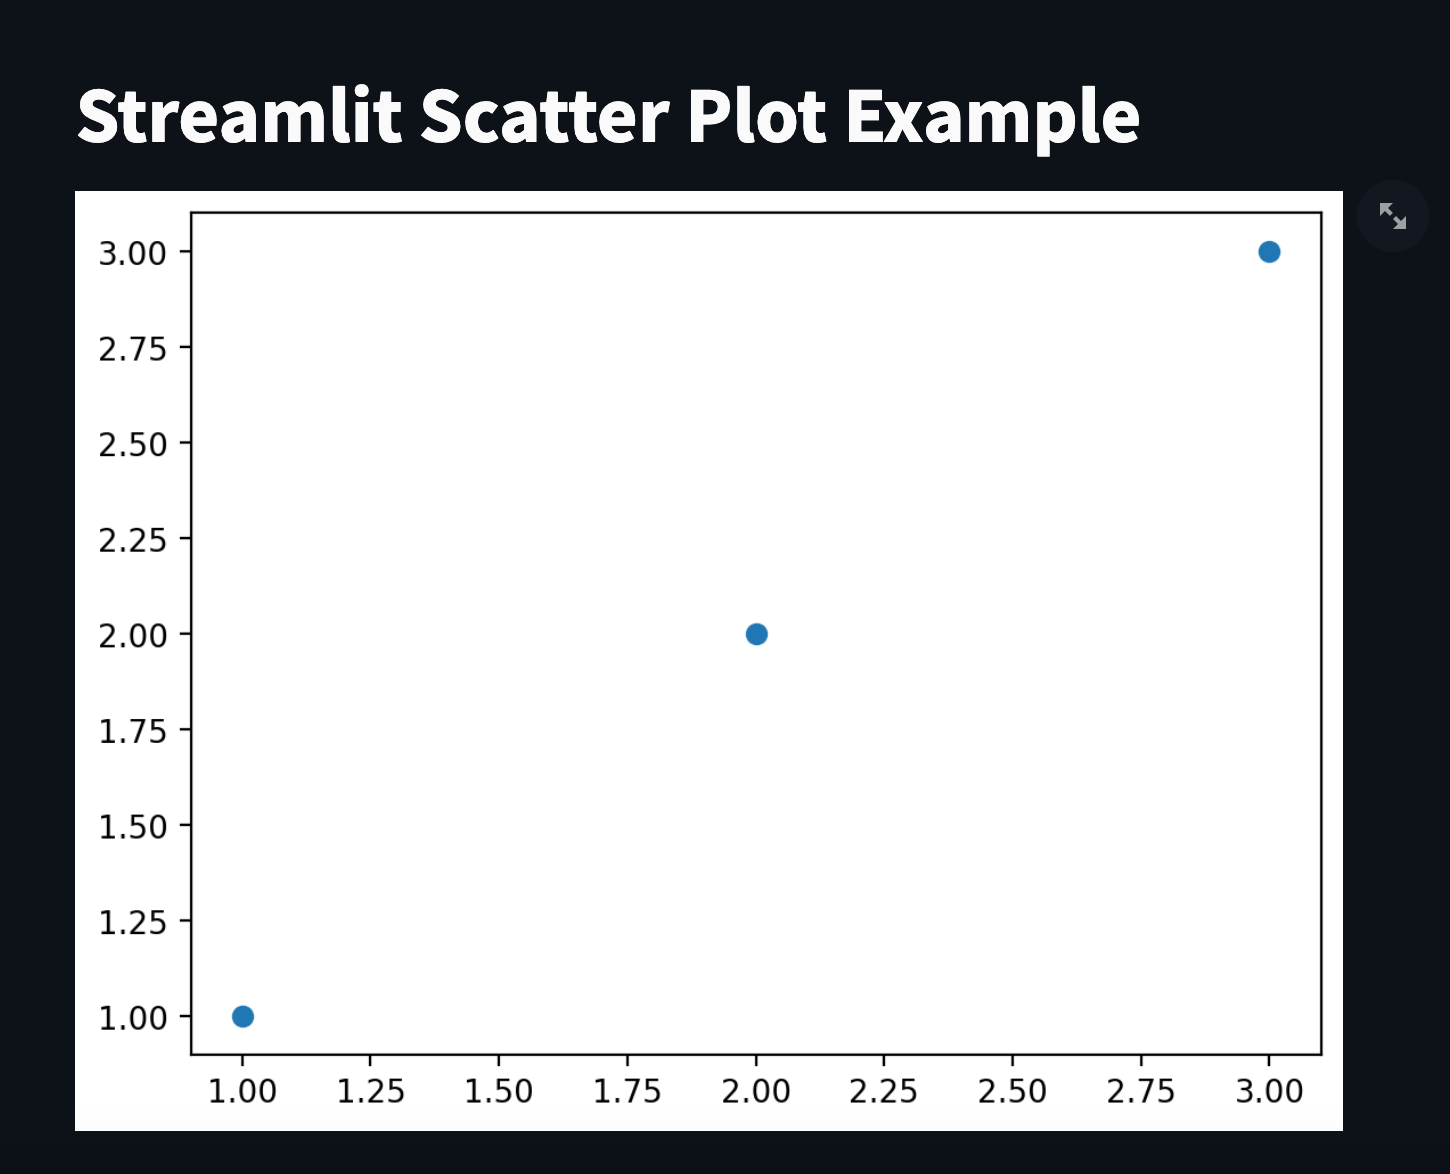
By running this script using Streamlit, you will see an interactive scatter plot displayed in your web browser.
With its user-friendly interface and powerful features, Streamlit is a valuable tool for data scientists and developers looking to create interactive data visualization applications quickly and efficiently.
Advantages of Streamlit
Streamlit is a versatile Python library that offers numerous advantages for developers and data scientists alike. Let's explore some of the key benefits of using Streamlit:
1. Easy-to-Use Interface
One of the major advantages of Streamlit is its user-friendly interface. Developers can quickly create interactive web applications without the need for extensive coding knowledge. Streamlit's intuitive design makes it easy to build and deploy applications, making it ideal for both beginners and experienced developers.
2. Interactive Widgets for Data Visualization
Streamlit provides a wide range of interactive widgets that allow users to visualize data in various formats. From simple scatter plots to complex interactive charts, Streamlit offers a diverse set of tools for data visualization. These widgets make it easy to explore and analyze data in a dynamic and engaging way.
3. Built-In Support for Popular Data Science Libraries
Streamlit comes with built-in support for popular data science libraries such as Pandas and Matplotlib. This seamless integration allows developers to leverage the power of these libraries within their Streamlit applications, enhancing the capabilities and functionality of their projects.
4. Automatic Hot Reloading for Instant Updates
With Streamlit, developers can enjoy automatic hot reloading, which enables instant updates to the application as soon as changes are made to the code. This real-time feedback loop streamlines the development process and allows for quick iterations and improvements.
5. Seamless Deployment Options
Streamlit provides effortless deployment solutions, simplifying the process of sharing applications with others. Whether deploying to a local server or to the cloud, Streamlit provides straightforward deployment processes that ensure applications are accessible to a wide audience.
By leveraging the advantages of Streamlit, developers can create powerful and interactive web applications for data science and machine learning projects with ease. The combination of its user-friendly interface, interactive widgets, and seamless deployment options make Streamlit a valuable tool for building cutting-edge applications.
Basic streamlit functions:
Text Display:
import streamlit as st

st.title("Hello, Streamlit!")
st.write("This is some text displayed on the app.")

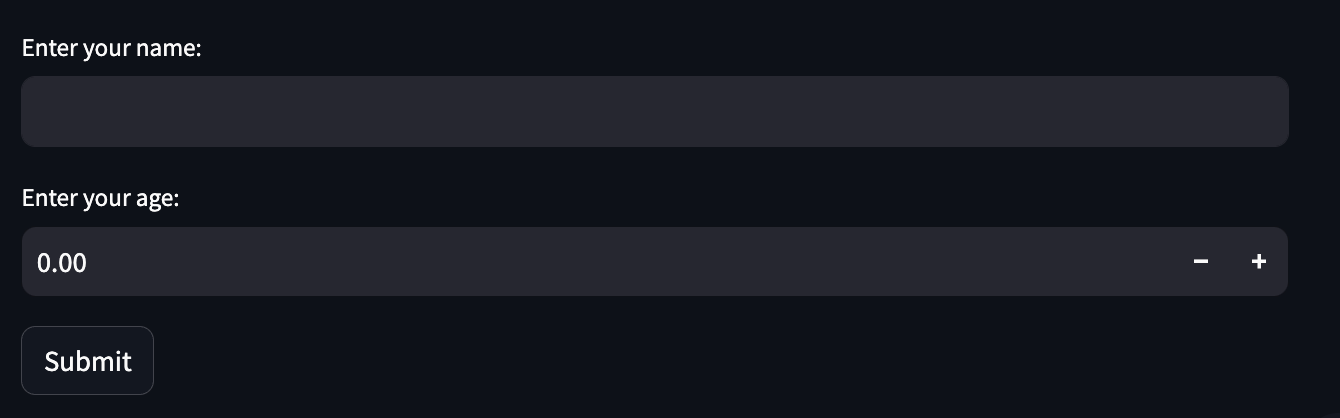
Input Widgets:
name = st.text_input("Enter your name:")
age = st.number_input("Enter your age:")
if st.button("Submit"):
    st.write("Hello, {}! You are {} years old.".format(name, age))
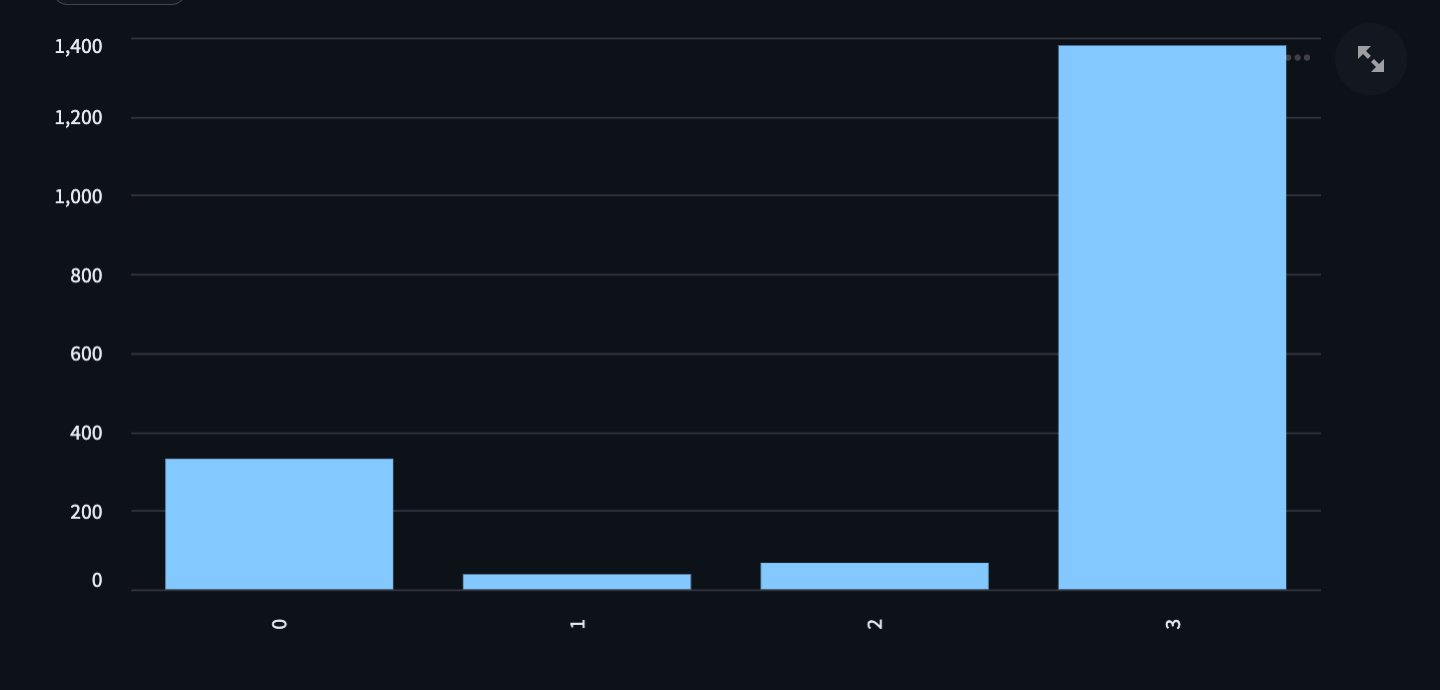
Data Visualization:
import pandas as pd

data = pd.DataFrame({
    "Country": ["US", "Canada", "UK", "India"],
    "Population": [331, 38, 67, 1380]
})

st.bar_chart(data["Population"])
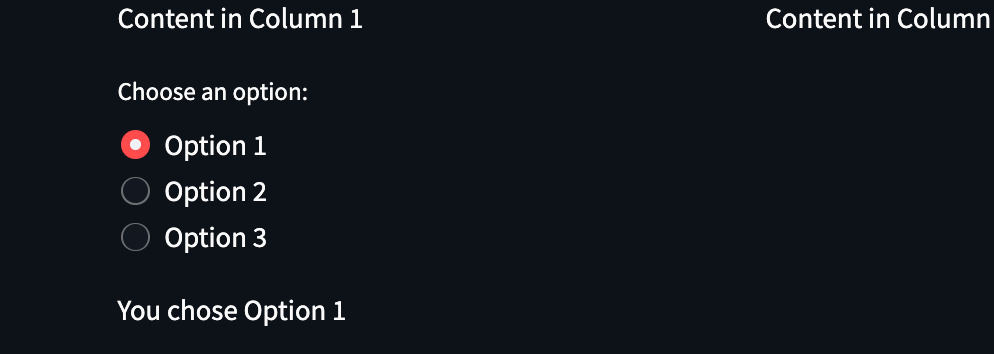
Layouts:
col1, col2 = st.columns(2)
with col1:
    st.header("Column 1")
    st.write("Content in Column 1")
with col2:
    st.header("Column 2")
    st.write("Content in Column 2")

Checkboxes and Radio Buttons:
selected_option = st.radio("Choose an option:", ("Option 1", "Option 2", "Option 3"))
if selected_option == "Option 1":
    st.write("You chose Option 1")
Images and Videos:
st.image("bblangsmith.png")  # Replace with your image path
st.video("https://www.youtube.com/watch?v=A6dV1zCXc3s")  # Replace with your video path
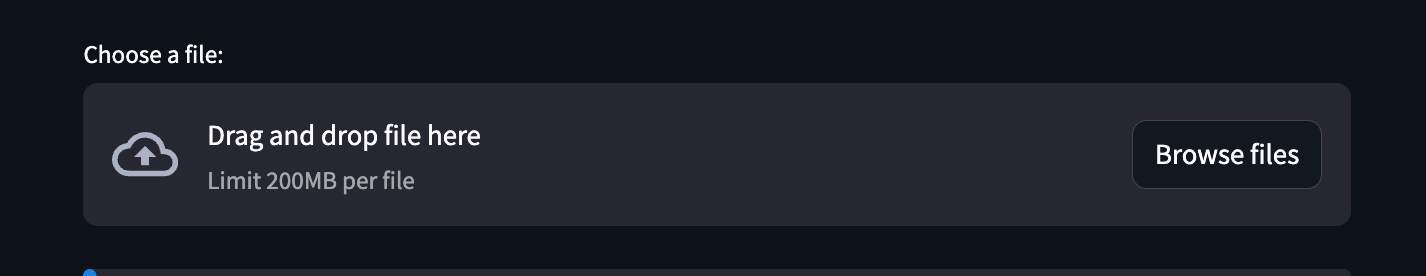
File Upload:
uploaded_file = st.file_uploader("Choose a file:")
if uploaded_file is not None:
    bytes_data = uploaded_file.read()
    st.write("You uploaded a file.")
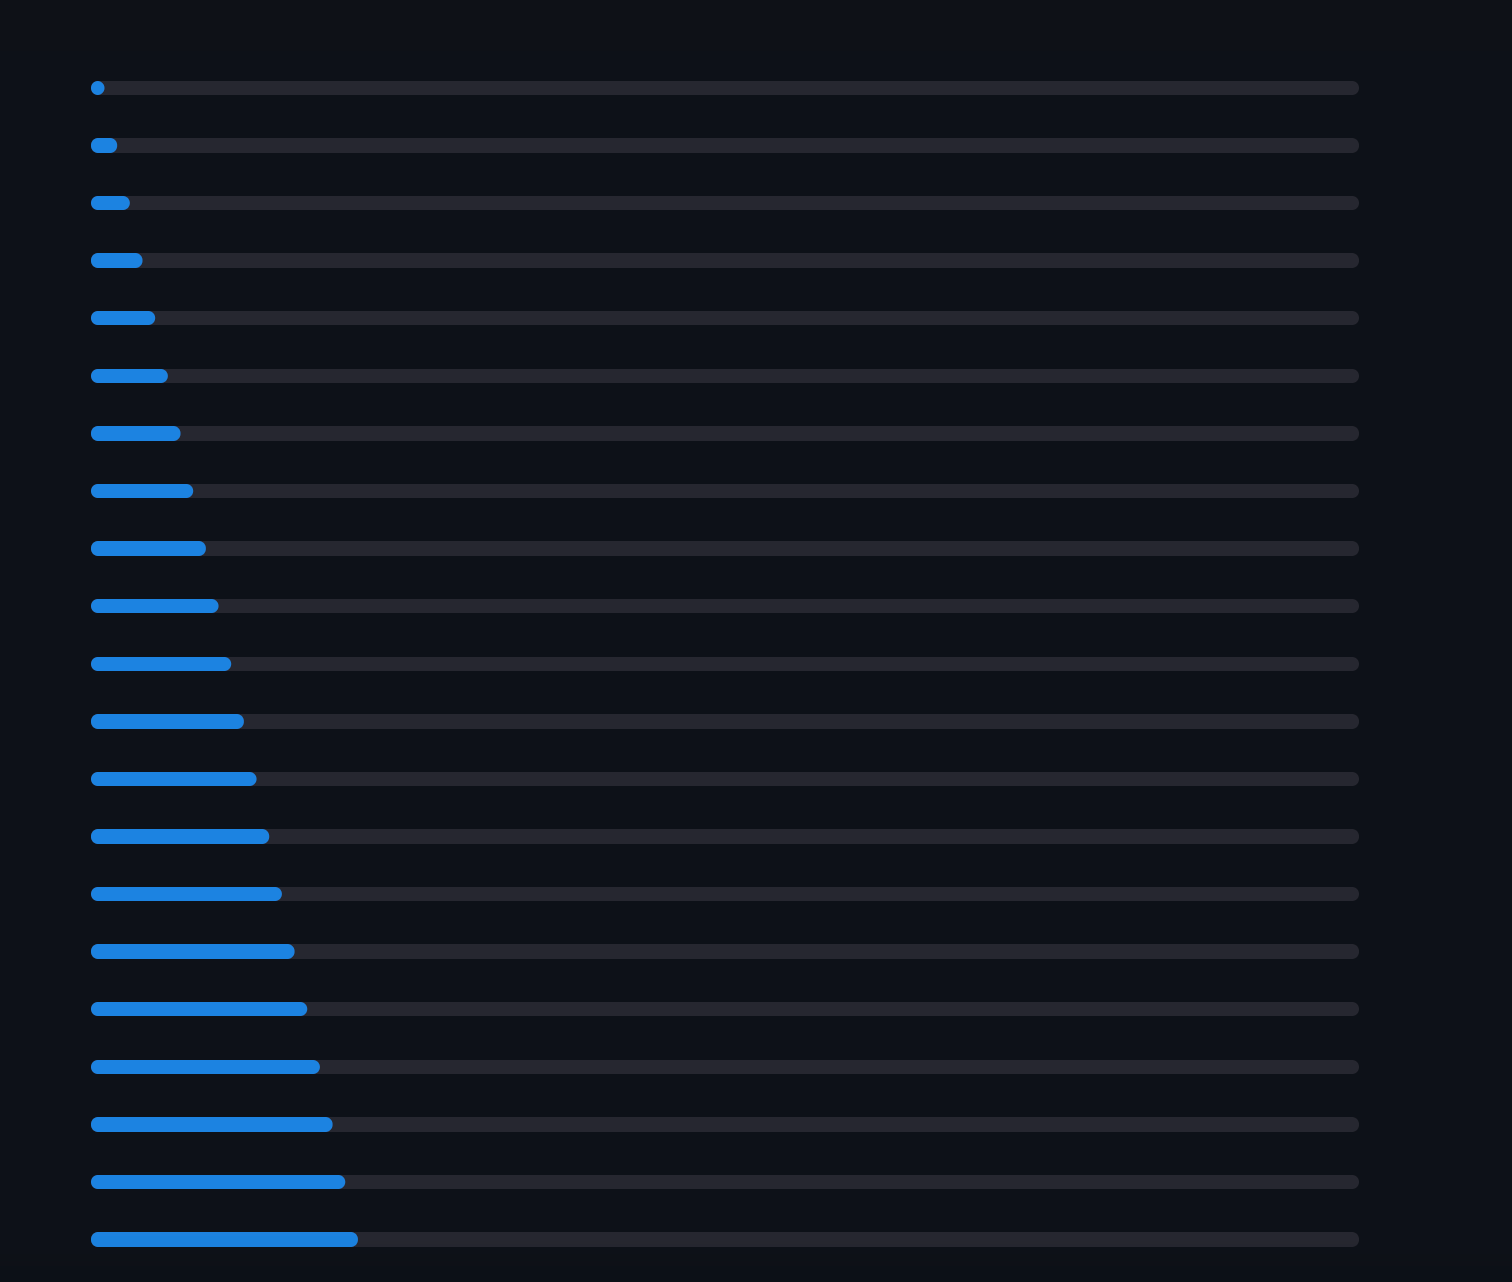
Progress Bars:
import time

for i in range(100):
    time.sleep(0.1)
    st.progress(i + 1)
Caching Data:
@st.cache_data
def get_data():
    # Simulate some expensive data loading
    time.sleep(2)
    return {"key": "value"}

data = get_data()
st.write(data)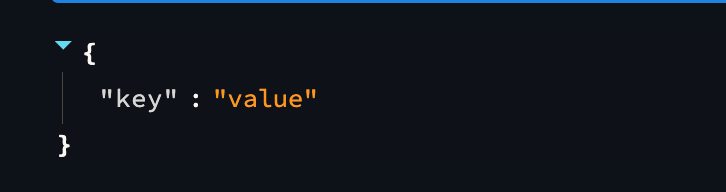
Interactive Widgets (Selectbox, Multiselect, Slider):
selected_fruit = st.selectbox("Choose a fruit:", ("Apple", "Banana", "Orange"))
st.write("You selected:", selected_fruit)

selected_fruits = st.multiselect("Choose multiple fruits:", ("Apple", "Banana", "Orange", "Grape"))
st.write("You selected:", selected_fruits)

age_range = st.slider("Select your age range:", 0, 100, (20, 50))
st.write("Your age range:", age_range)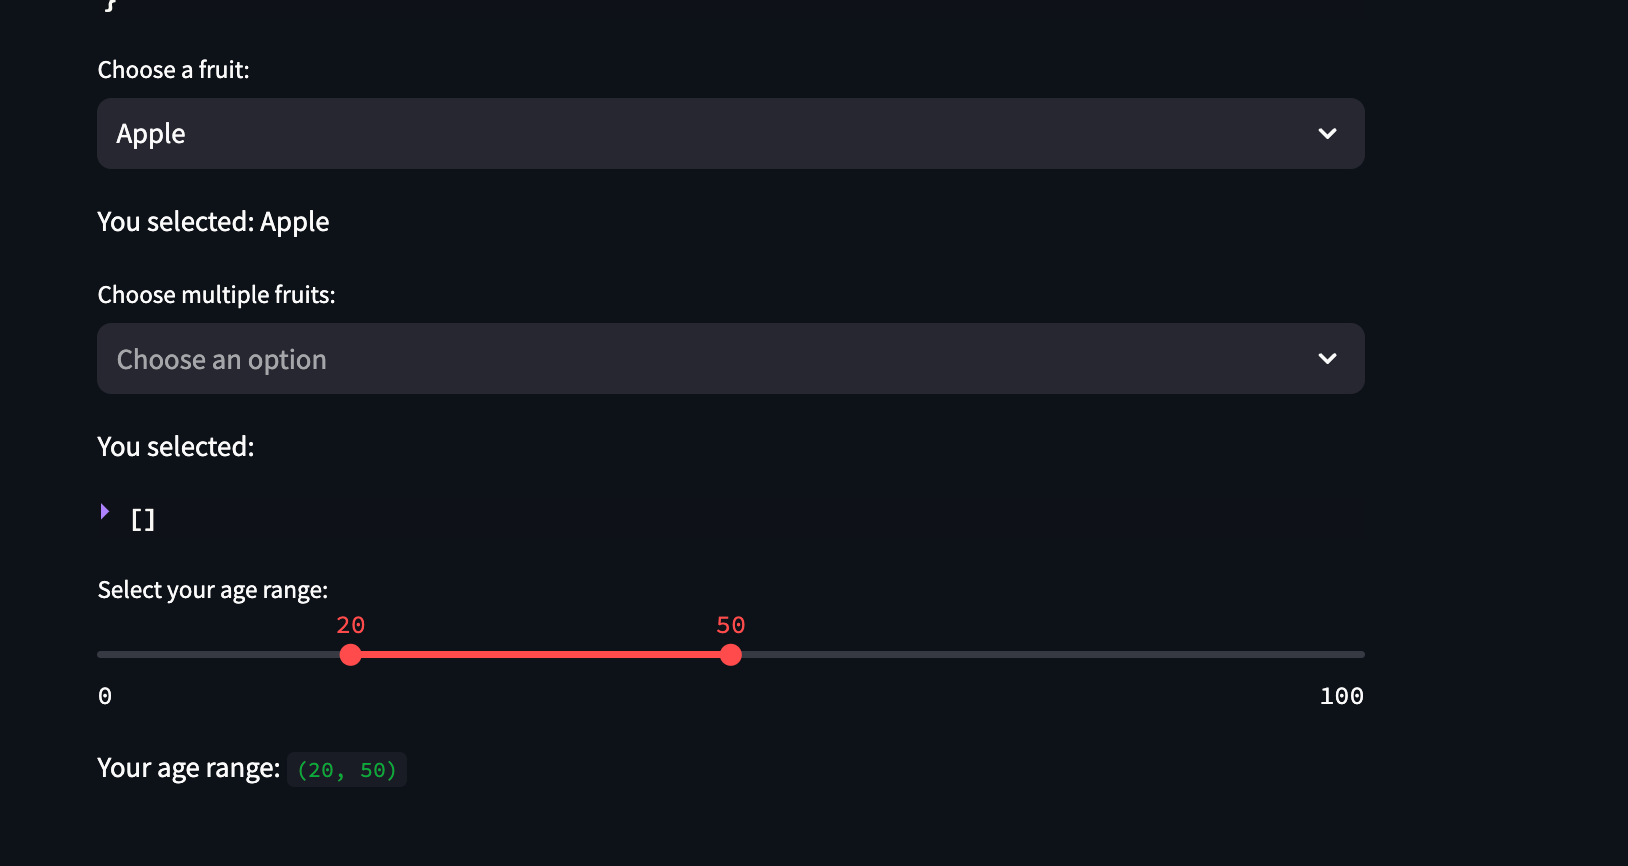
Streamlit Gallery: Inspiring Examples
As a developer or data scientist, exploring the Streamlit gallery can provide you with a wealth of inspiring examples and ideas for your own projects. The Streamlit gallery showcases a diverse range of interactive web applications created using Streamlit, demonstrating the power and versatility of this Python library.
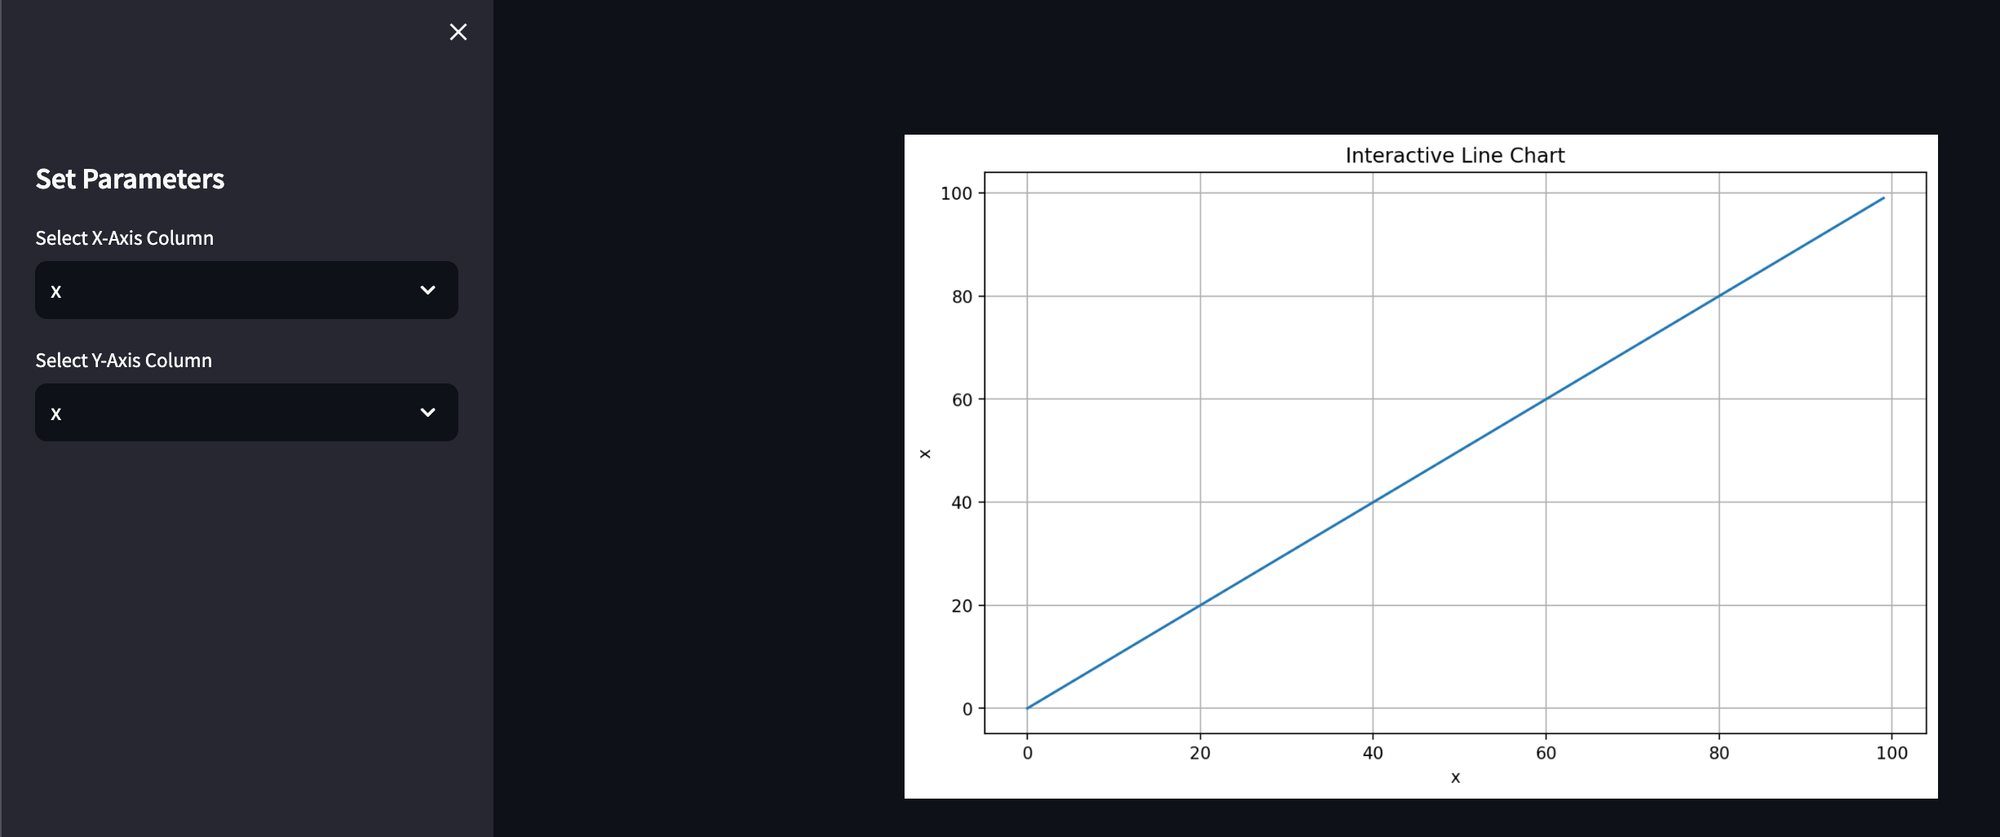
1. Interactive Data Visualization
One of the key strengths of Streamlit is its interactive widgets for data visualization. The gallery features examples of interactive charts, graphs, and maps that allow users to explore data in a dynamic and engaging way. These examples demonstrate the flexibility and creativity that Streamlit offers for creating visually appealing data visualization applications.
import streamlit as st
import pandas as pd
import numpy as np
import matplotlib.pyplot as plt

# Create a sample DataFrame
data = pd.DataFrame({
    'x': range(100),
    'y': np.random.randn(100)
})

# Function to plot line chart
def plot_line_chart(data, x_column, y_column):
    fig, ax = plt.subplots(figsize=(10, 6))
    ax.plot(data[x_column], data[y_column])
    ax.set_xlabel(x_column)
    ax.set_ylabel(y_column)
    ax.set_title("Interactive Line Chart")
    ax.grid(True)
    return fig

# Sidebar widgets for user input
st.sidebar.header('Set Parameters')
x_column = st.sidebar.selectbox('Select X-Axis Column', data.columns)
y_column = st.sidebar.selectbox('Select Y-Axis Column', data.columns)

# Plot the line chart based on user input
fig = plot_line_chart(data, x_column, y_column)
st.pyplot(fig)
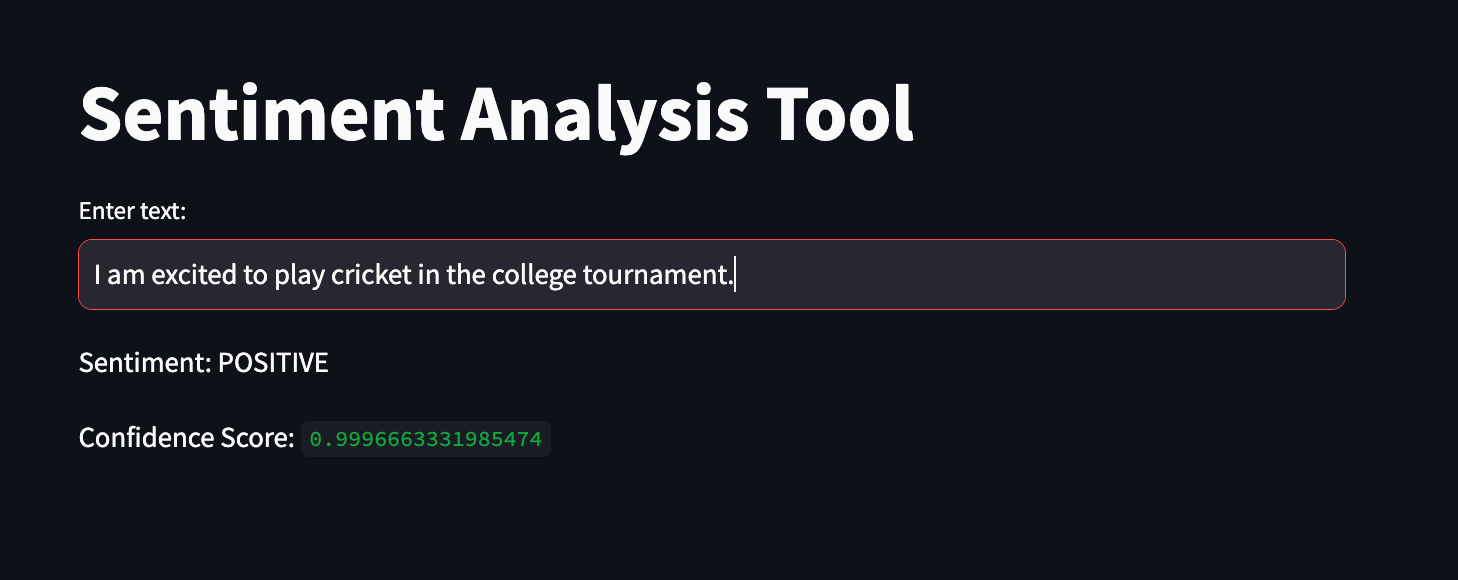
2. Machine Learning Applications
Streamlit is also well-suited for building machine learning applications, and the gallery showcases examples of predictive models, image recognition tools, and sentiment analysis applications. These examples highlight the seamless integration of machine learning algorithms with Streamlit's user-friendly interface, making it easy to deploy and interact with AI-powered applications.
import streamlit as st
from transformers import pipeline

# Load the sentiment analysis model
sentiment_analysis = pipeline("sentiment-analysis")

# Streamlit UI
st.title("Sentiment Analysis Tool")
user_input = st.text_input("Enter text:")
if user_input:
    # Perform sentiment analysis
    result = sentiment_analysis(user_input)
    st.write("Sentiment:", result[0]['label'])
    st.write("Confidence Score:", result[0]['score'])
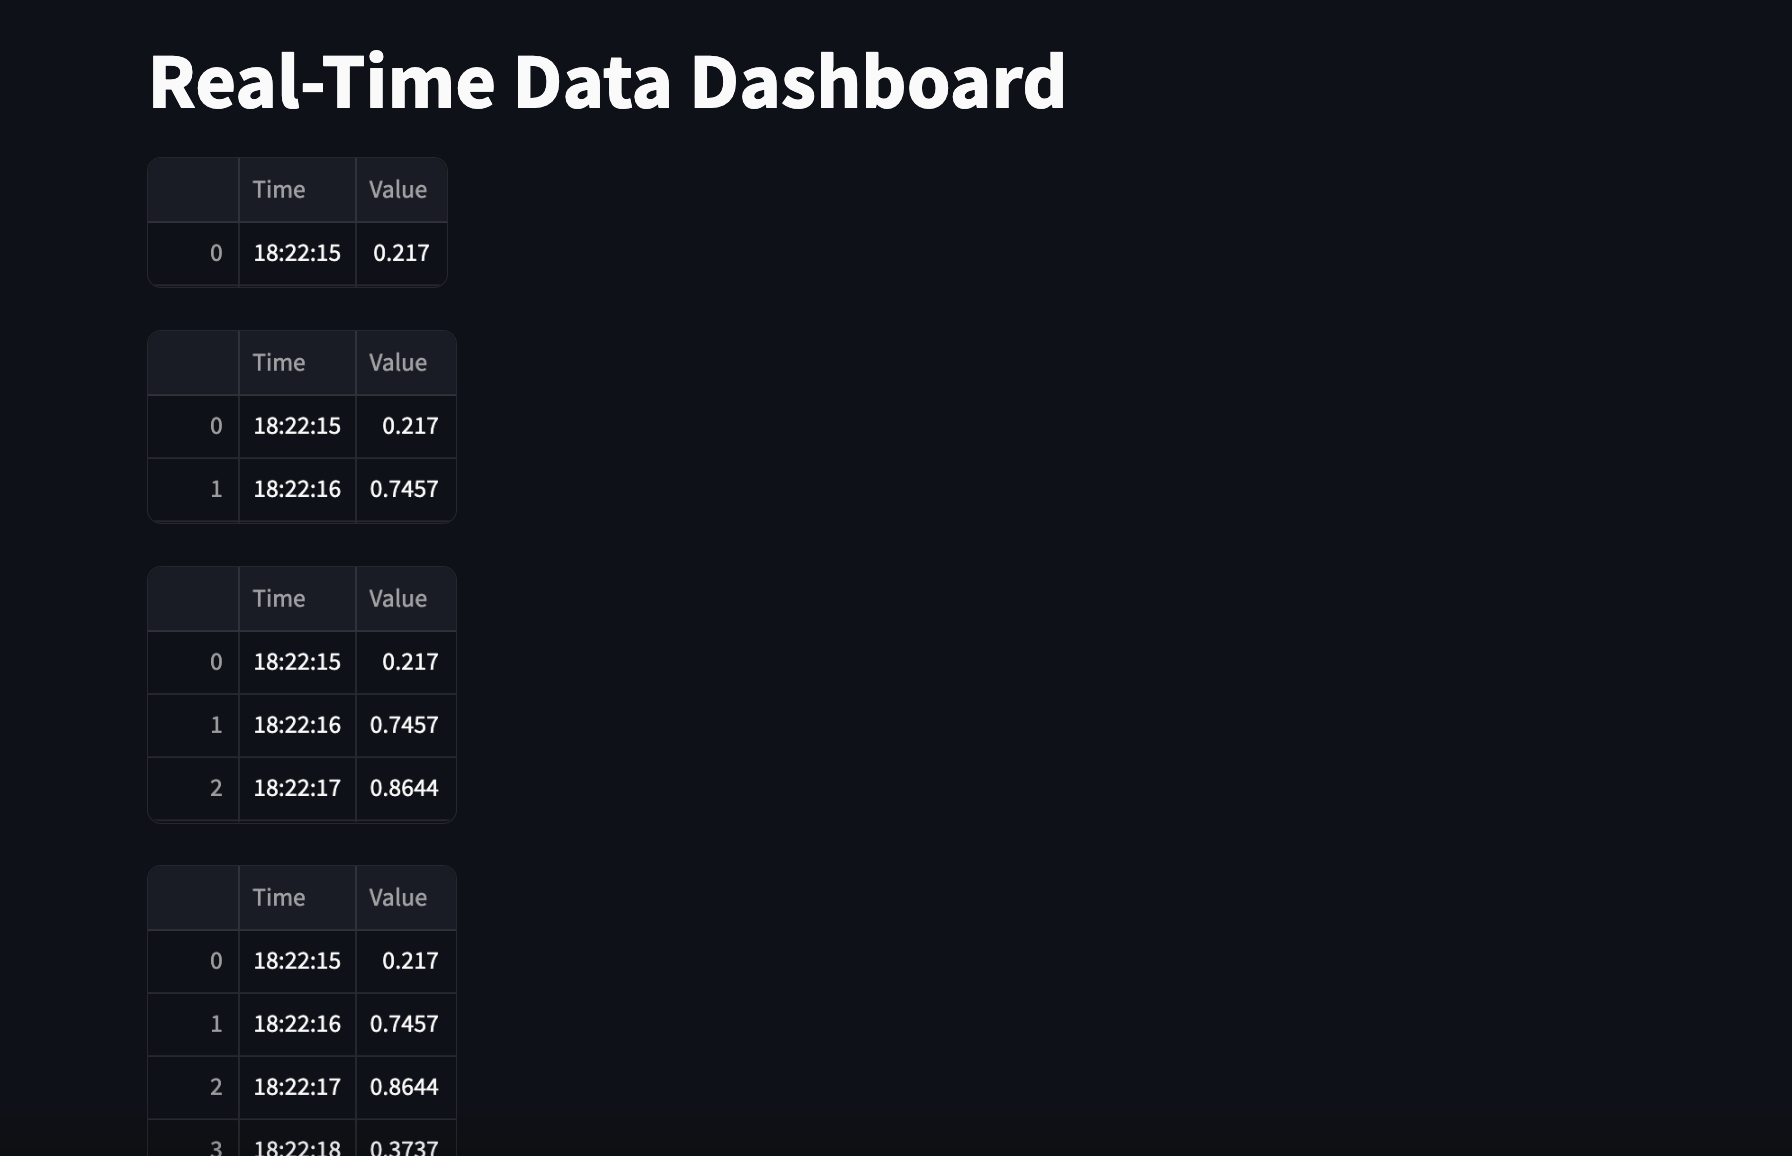
3. Real-Time Data Streaming
Streamlit's seamless deployment options make it ideal for showcasing real-time data streaming applications. The gallery features examples of live data feeds, dynamic dashboards, and interactive maps that update in real-time. These examples demonstrate how Streamlit can be used to create engaging and responsive applications that react to changing data on the fly.
import streamlit as st
import pandas as pd
import numpy as np
import time

# Function to generate random data
def generate_random_data():
    data = {
        'Time': [time.strftime("%H:%M:%S")],
        'Value': [np.random.rand()]
    }
    return pd.DataFrame(data)

# Streamlit UI
st.title("Real-Time Data Dashboard")

# Initialize empty DataFrame
df = pd.DataFrame(columns=['Time', 'Value'])

# Create a loop to update data in real-time
while True:
    # Generate random data
    new_data = generate_random_data()

    # Append new data to DataFrame
    df = pd.concat([df, new_data], ignore_index=True)

    # Display updated DataFrame
    st.write(df)

    # Wait for a short interval before generating new data
    time.sleep(1)
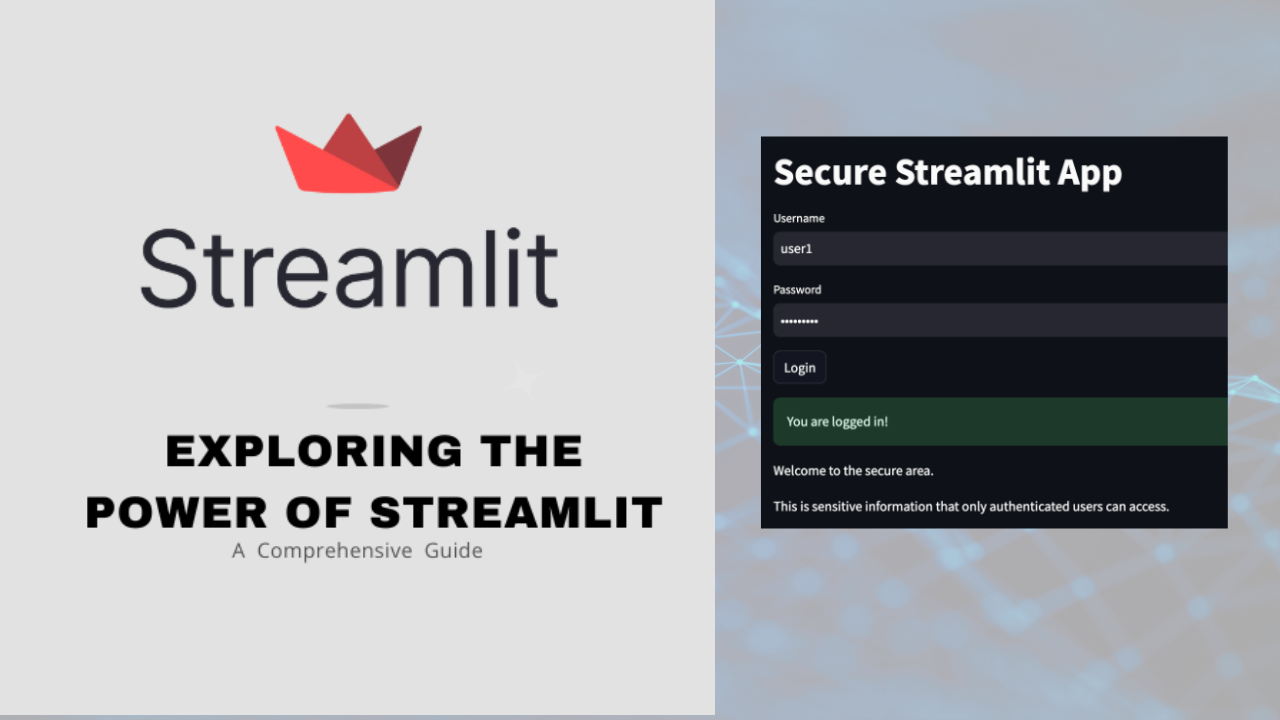
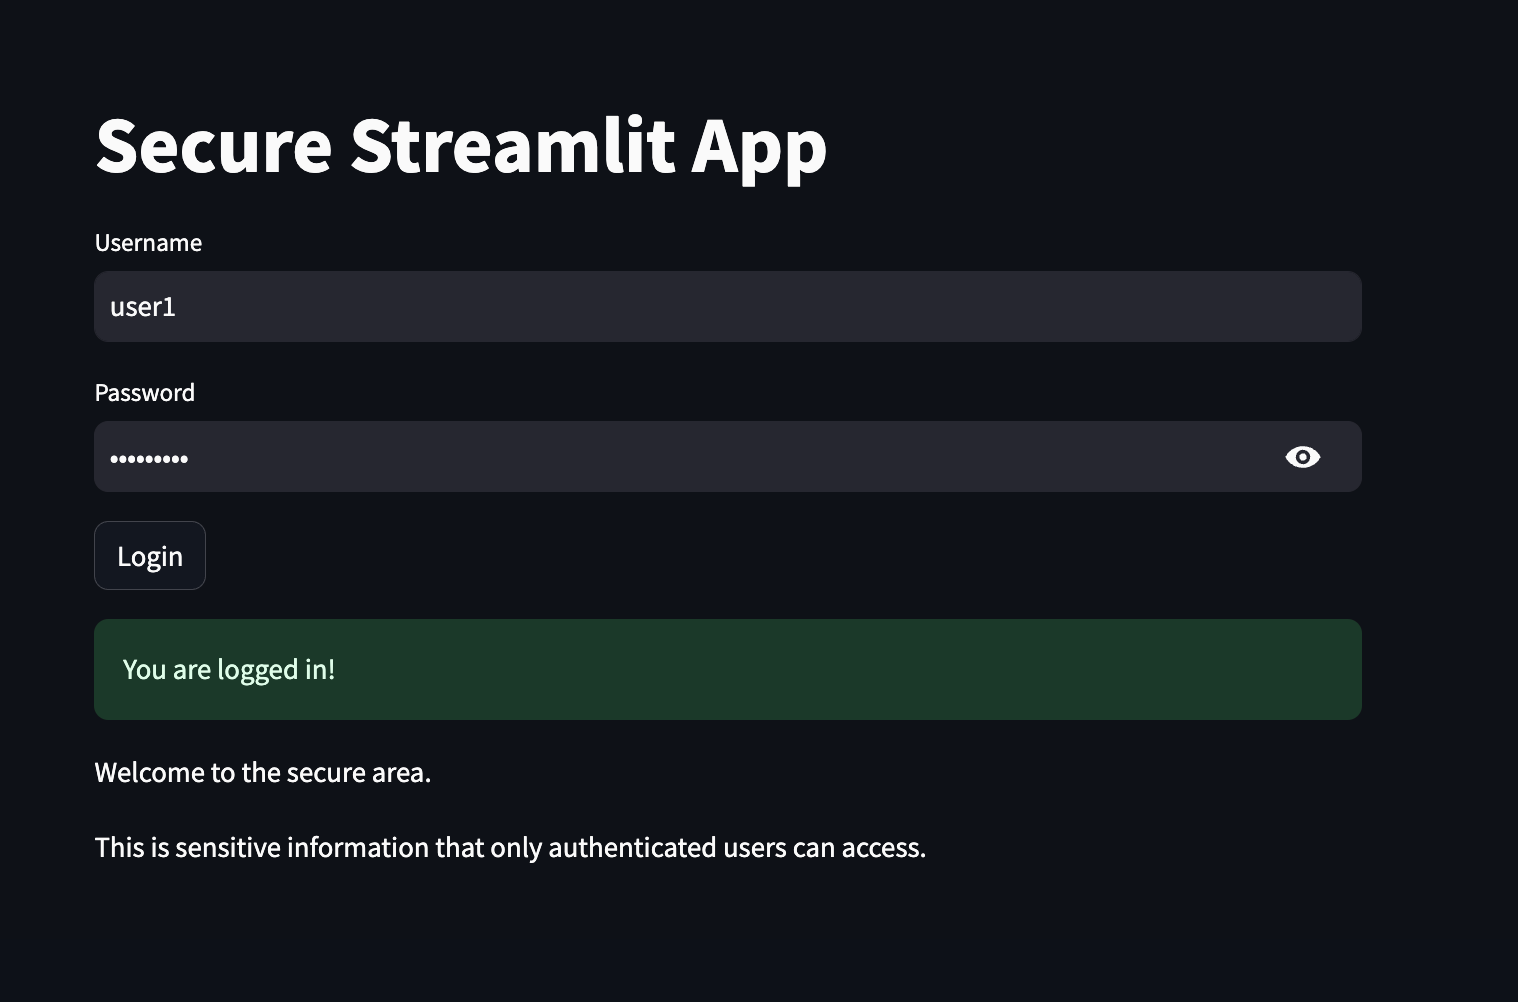
4. Secure Your Application
Security is paramount when deploying web applications, especially those that handle sensitive data or user information. Ensure that your Streamlit application is secure by implementing proper authentication, encryption, and access control mechanisms. Additionally, regularly update your dependencies to patch any security vulnerabilities.
import streamlit as st
import secrets

# Define a dictionary of authorized users (username: password)
AUTHORIZED_USERS = {
    'user1': 'password1',
    'user2': 'password2'
}

# Streamlit UI
st.title("Secure Streamlit App")

# Check if user is authenticated
if 'authenticated' not in st.session_state:
    st.session_state.authenticated = False

# Authentication form
if not st.session_state.authenticated:
    username = st.text_input("Username")
    password = st.text_input("Password", type="password")

    if st.button("Login"):
        if username in AUTHORIZED_USERS and AUTHORIZED_USERS[username] == password:
            st.session_state.authenticated = True
        else:
            st.error("Invalid username or password. Please try again.")

# Protected content
if st.session_state.authenticated:
    st.success("You are logged in!")
    st.write("Welcome to the secure area.")
    st.write("This is sensitive information that only authenticated users can access.")
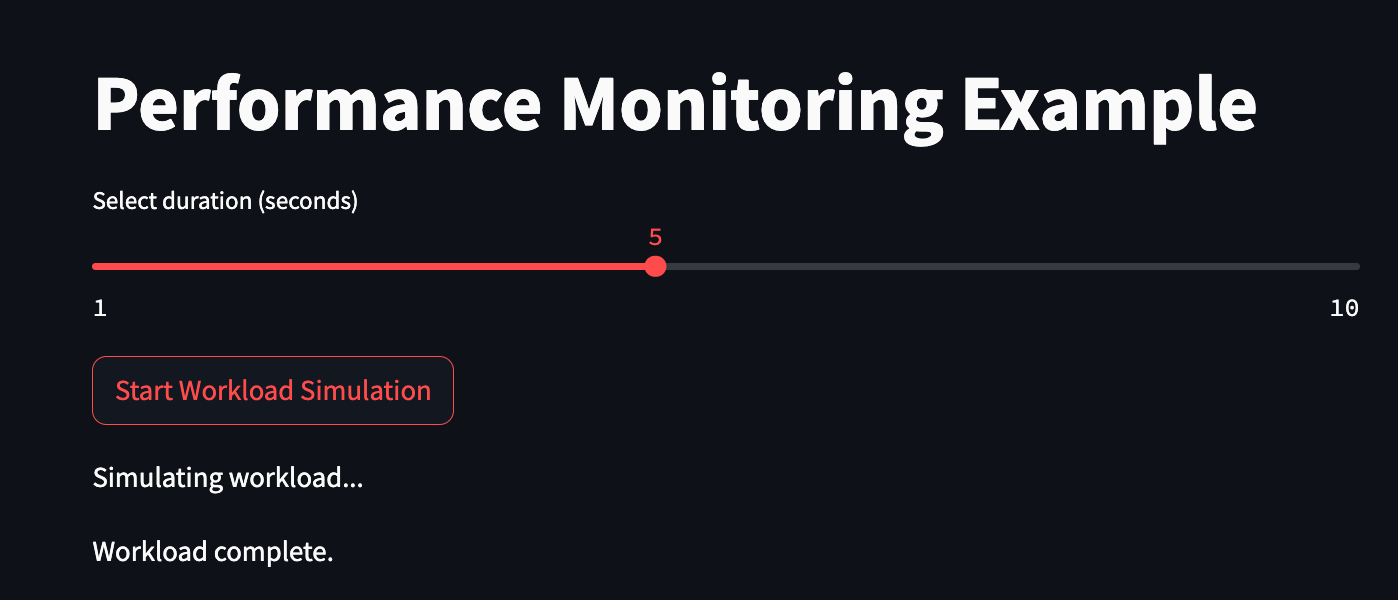
5. Monitor Performance Metrics
Monitoring the performance of your Streamlit application is crucial for identifying bottlenecks, optimizing resource usage, and improving overall user experience. Use logging and monitoring tools to track key performance metrics such as response times, memory usage, and error rates.
import streamlit as st
import time

# Function to simulate workload
def simulate_workload(duration):
    st.write("Simulating workload...")
    time.sleep(duration)
    st.write("Workload complete.")

# Streamlit UI
st.title("Performance Monitoring Example")

# User input for duration
duration = st.slider("Select duration (seconds)", min_value=1, max_value=10, value=5)

# Button to start workload simulation
if st.button("Start Workload Simulation"):
    simulate_workload(duration)

# Set query parameter with duration
st.experimental_set_query_params(duration=duration)
Exploring the Streamlit gallery can provide you with valuable insights and inspiration for your own projects, whether you are looking to create interactive data visualization tools, machine learning applications, or real-time data streaming dashboards. The examples in the gallery showcase the endless possibilities of what can be achieved with Streamlit's powerful features and intuitive interface.
Conclusion and Future of Streamlit
As we conclude our exploration of Streamlit, it is evident that this Python library offers a wide array of features and advantages for developers and data scientists. From its easy-to-use interface to its seamless deployment options, Streamlit has become a popular choice for creating interactive web applications in the realm of data science and machine learning.
Future Developments in Streamlit
Looking ahead, the future of Streamlit appears promising with ongoing developments and enhancements to further improve the user experience and functionality of the library. Some potential future developments in Streamlit may include:
- Enhanced Customization: Streamlit may introduce more customization options for widgets and visualizations to cater to diverse project requirements.
- Advanced Machine Learning Integration: Future updates may focus on enhancing the integration of machine learning models and algorithms within Streamlit applications.
- Real-Time Collaboration: Streamlit could introduce features for real-time collaboration, enabling multiple users to work on an application simultaneously.
- Improved Performance Metrics: Future versions of Streamlit may offer enhanced monitoring and performance metrics for developers to optimize their applications.
By staying abreast of the latest developments and updates in Streamlit, developers can leverage the full potential of this powerful Python library to create innovative and impactful projects. Here is the official documentation of streamlit -> click here.
FAQ's
- What is Streamlit used for?
Streamlit is used for building interactive web applications and data dashboards using Python. It allows users to create data-driven applications quickly and easily by writing simple Python scripts. - Is Streamlit a frontend or backend?
Streamlit is primarily a frontend framework for building web applications. It provides tools and libraries for creating user interfaces and visualizations directly within Python scripts. However, Streamlit applications can interact with backend services and databases to fetch and process data. - Is Streamlit better than Flask?
Streamlit and Flask serve different purposes and have different use cases. Streamlit is designed specifically for building data-centric web applications with a focus on simplicity and interactivity. It excels at rapid prototyping and creating interactive data visualizations. Flask, on the other hand, is a more general-purpose web framework for building full-fledged web applications with more flexibility and customization options. - Is Streamlit still free?
Yes, Streamlit is open-source and free to use. There is no cost associated with using Streamlit for building and deploying web applications. - What is Streamlit good for?
Streamlit is good for building interactive web applications and data dashboards, particularly for data science and machine learning projects. It simplifies the process of creating interactive visualizations, allowing users to focus on data analysis and visualization without needing to learn complex web development technologies. - Can you do UI with Python?
Yes, you can create user interfaces (UI) with Python using frameworks and libraries like Streamlit, Tkinter, PyQt, PyGTK, and Kivy. These tools enable developers to build desktop applications, web applications, and mobile apps with Python as the backend language. - Is Python good for user interface design?
Python is suitable for user interface design, especially for applications that require rapid development or integration with data analysis and machine learning pipelines. Python's simplicity, readability, and extensive libraries make it a popular choice for building user interfaces across different platforms. However, for highly complex or performance-critical applications, other languages and frameworks may be more suitable.