


Enhance Your Python Skills with Pandas

What is Pandas library?
Pandas is an open-source library in Python that is specifically designed for working with relational or labeled data in an intuitive and efficient manner. It offers a wide range of data structures and functions for manipulating numerical data and time series, making it a valuable tool for data analysis and manipulation.
Why Use Pandas?
There are numerous reasons to use Pandas for data analysis. Firstly, Pandas provides easy syntax and fast operations, which make working with tabular data such as spreadsheets and databases incredibly convenient. The main data structures in Pandas are the Series and DataFrames classes, which allow for flexible representation of real data with rows and columns.
Furthermore, Pandas integrates the functionality of other popular Python libraries like NumPy and Matplotlib, offering a wide range of opportunities for data analytics and visualization. This integration makes Python a highly flexible and effective tool for data analysis tasks.
Benefits of Learning Pandas for Data Analysis
- Pandas tutorial: Dive into the world of Pandas and learn how to manipulate and analyze data efficiently.
- Data cleaning with Pandas: Discover how Pandas can be used to clean and preprocess data for analysis.
- Dataframes in Pandas: Understand the concept of DataFrames in Pandas and how they can be used to store and manipulate data.
- Python data analysis: Enhance your Python skills by mastering data analysis with Pandas.
- Pandas functions: Explore the various functions and methods available in Pandas for data manipulation and analysis.
Getting Started with Pandas
To get started with Pandas, it is recommended to have some basic knowledge of Python and fundamental programming concepts like variables, lists, functions, and loops. Once you are familiar with these basics, you can start exploring the powerful functionalities of Pandas for processing, summarizing, analyzing, and visualizing large quantities of data.
Whether you are a beginner or an experienced Python programmer, learning Pandas can significantly enhance your data analysis skills and open up new opportunities for exploring and understanding complex datasets.
Working with Dataframes
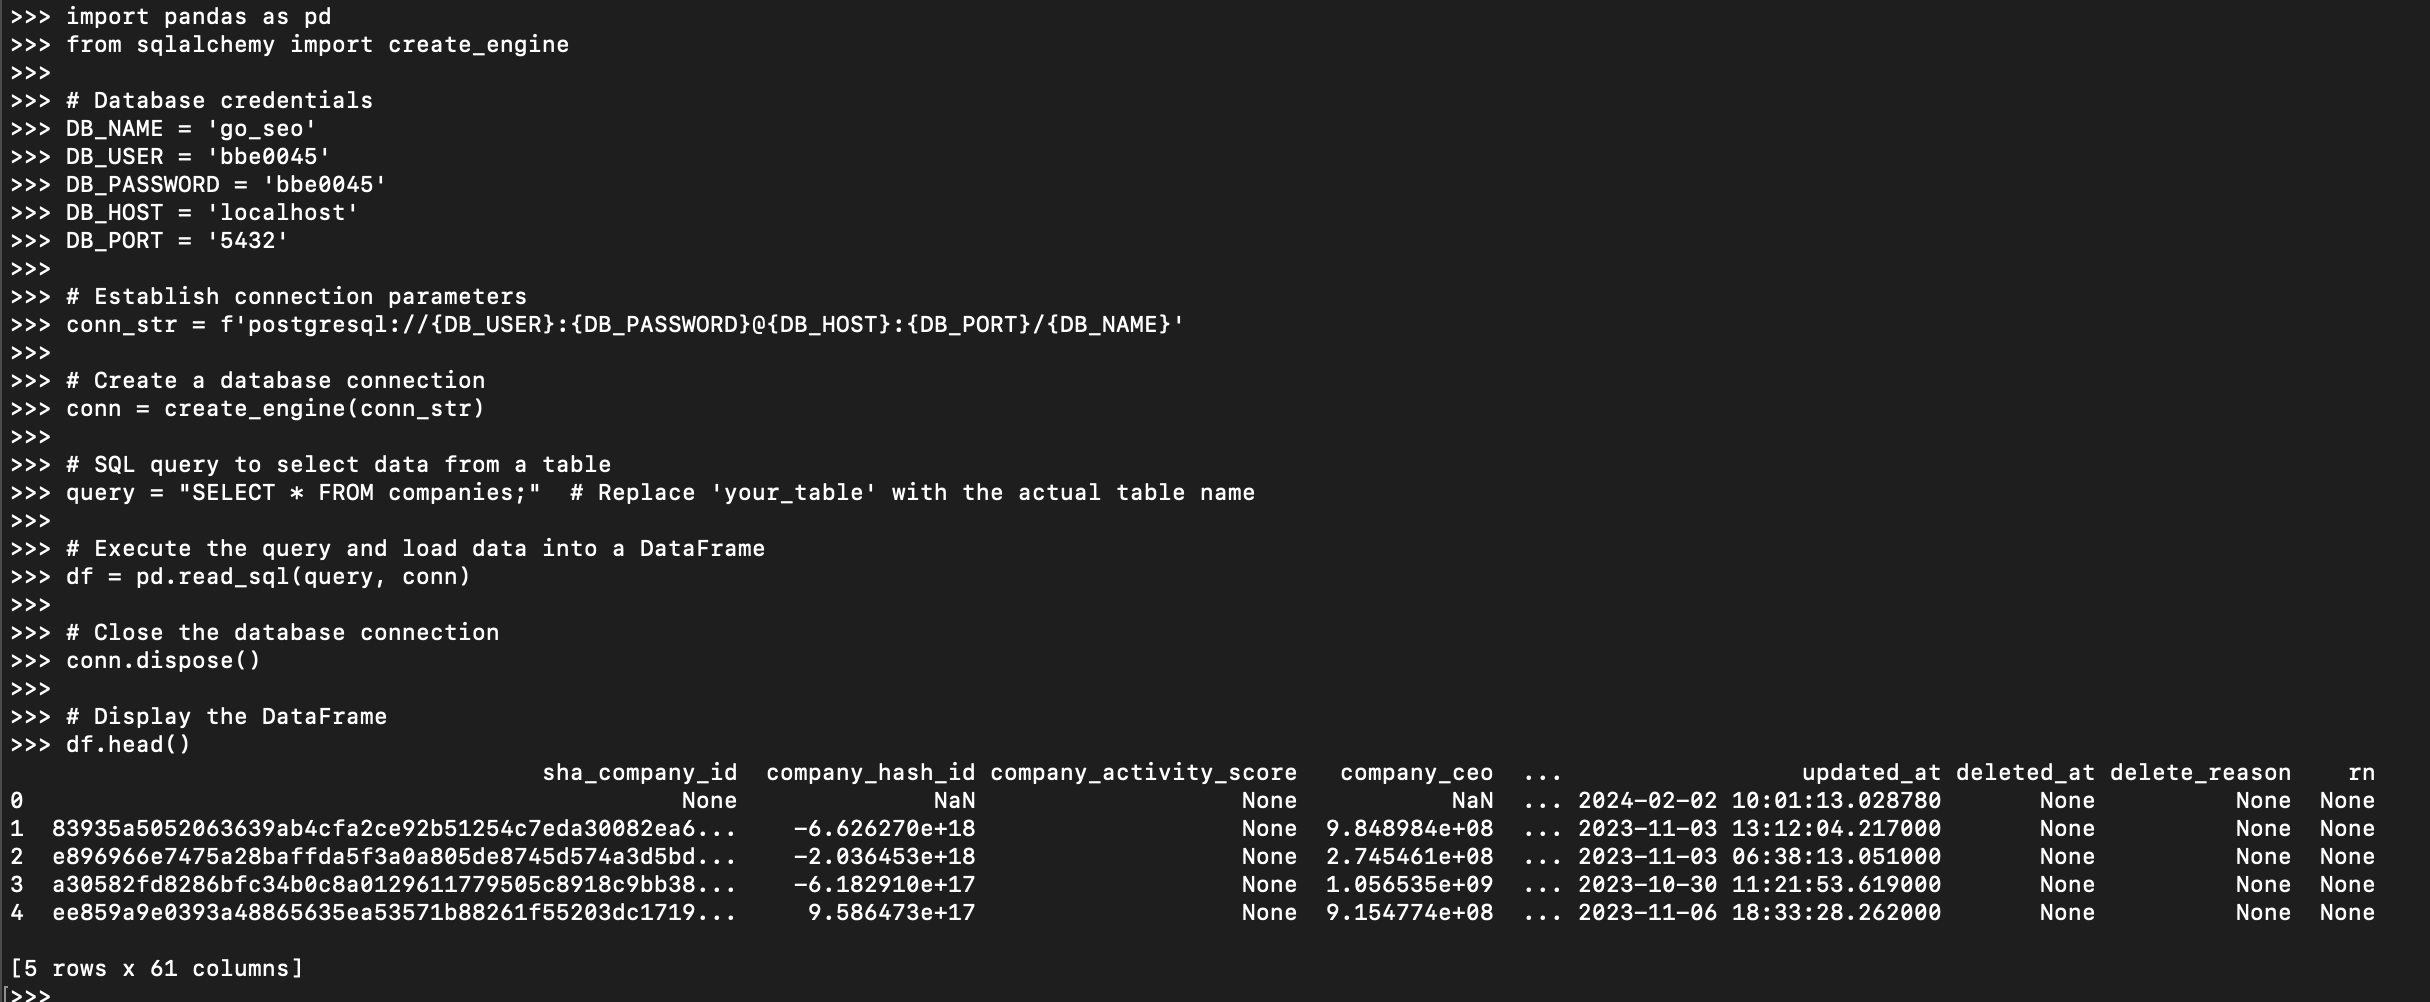
To work with Dataframes in Pandas, you can create a DataFrame from scratch by passing in a dictionary or a list of lists. Additionally, you can read data from external sources like CSV files or databases using the read_csv() and read_sql() functions. Once you have a DataFrame, you can perform a wide range of operations such as selecting specific columns, filtering rows based on conditions, and calculating summary statistics.
import pandas as pd
df = pd.read_csv('Reviews.csv')
df.head()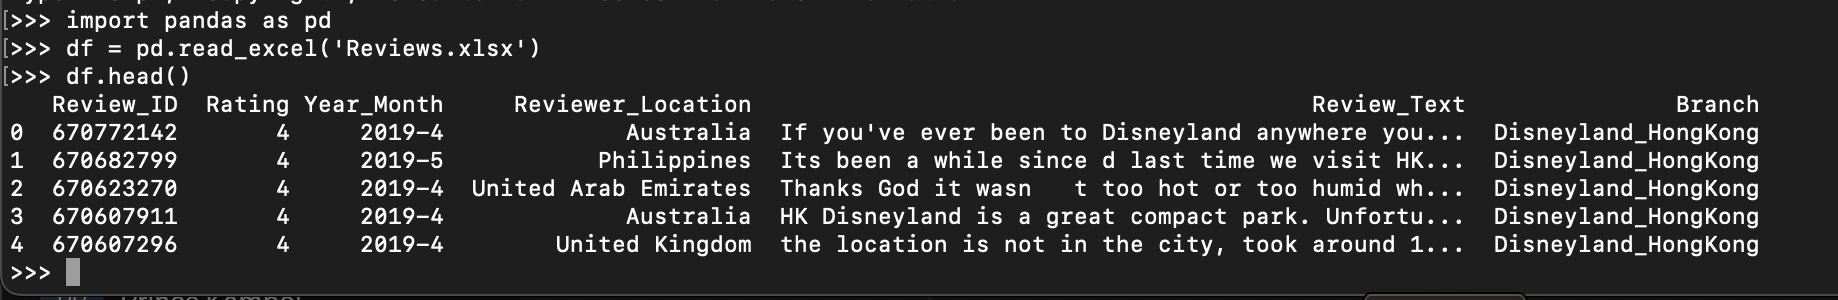
import pandas as pd
from sqlalchemy import create_engine

# Database credentials
DB_NAME = 'xxx'
DB_USER = 'xxx'
DB_PASSWORD = 'xxx'
DB_HOST = 'localhost'
DB_PORT = '5432'

# Establish connection parameters
conn_str = f'postgresql://{DB_USER}:{DB_PASSWORD}@{DB_HOST}:{DB_PORT}/{DB_NAME}'

# Create a database connection
conn = create_engine(conn_str)

# SQL query to select data from a table
query = "SELECT * FROM companies;"  # Replace 'your_table' with the actual table name

# Execute the query and load data into a DataFrame
df = pd.read_sql(query, conn)

# Close the database connection
conn.dispose()

# Display the DataFrame
df.head()
Data Cleaning Techniques with Pandas
When it comes to data analysis, one of the crucial steps is data cleaning. Data cleaning involves identifying and correcting errors or inconsistencies in the data to improve its quality and reliability. Pandas provides a wide range of tools and techniques for cleaning and preprocessing data efficiently.
Handling Missing Values and Remove Duplicates
One common issue in datasets is the presence of missing values. Pandas offers various functions like isnull(), notnull(), dropna(), fillna() and drop_duplicates() and to handle missing values effectively. These functions allow you to either remove rows or columns with missing values or fill them with appropriate values based on the context of the data.
isnull() Function:
The isnull() function returns a boolean DataFrame where True indicates missing values (NaN), and False indicates non-missing values.
import pandas as pd

# Create a DataFrame with missing values
data = {'A': [1, 2, None, 4, 5],
        'B': [None, 'foo', 'bar', None, 'baz']}
df = pd.DataFrame(data)

# Check for missing values
null_mask = df.isnull()
print(null_mask)
notnull() Function:
The notnull() function returns a boolean DataFrame where True indicates non-missing values, and False indicates missing values (NaN).
import pandas as pd

# Create a DataFrame with missing values
data = {'A': [1, 2, None, 4, 5],
        'B': [None, 'foo', 'bar', None, 'baz']}
df = pd.DataFrame(data)

# Check for non-missing values
not_null_mask = df.notnull()
print(not_null_mask)
dropna() Function:
The dropna() function is used to drop rows or columns containing missing values.
import pandas as pd

# Create a DataFrame with missing values
data = {'A': [1, 2, None, 4, 5],
        'B': [None, 'foo', 'bar', None, 'baz']}
df = pd.DataFrame(data)

# Drop rows with missing values
df_cleaned = df.dropna()
print(df_cleaned)
fillna() Function:
The fillna() function is used to fill missing values with a specified value or a method like 'ffill' or 'bfill' (forward fill or backward fill).
import pandas as pd

# Create a DataFrame with missing values
data = {'A': [1, 2, None, 4, 5],
        'B': [None, 'foo', 'bar', None, 'baz']}
df = pd.DataFrame(data)

# Fill missing values with a specified value (e.g., 0)
df_filled = df.fillna(0)
print(df_filled)
drop_duplicates() Function:
The drop_duplicates() function is used to remove duplicate rows from a DataFrame.
import pandas as pd

# Create a DataFrame with duplicate rows
data = {'A': [1, 2, 3, 1, 2, 3],
        'B': ['foo', 'bar', 'baz', 'foo', 'bar', 'baz']}
df = pd.DataFrame(data)

# Drop duplicate rows
df_unique = df.drop_duplicates()
print(df_unique)
Data Transformation
Another important aspect of data cleaning is data transformation. Pandas offers powerful functions like map(), apply(), and applymap() to transform data efficiently. These functions allow you to apply custom functions to individual elements, rows, or columns of a DataFrame, making it easy to clean and preprocess the data as needed.
map() Function:
The map() function is used for element-wise transformations on a Series.
import pandas as pd

# Create a DataFrame
data = {'A': [1, 2, 3, 4, 5],
        'B': [10, 20, 30, 40, 50]}
df = pd.DataFrame(data)

# Use map() to multiply each element in column 'A' by 2
df['A'] = df['A'].map(lambda x: x * 2)
print(df)
apply() Function:
The apply() function is used for applying a function along an axis of the DataFrame or Series.
import pandas as pd

# Create a DataFrame
data = {'A': [1, 2, 3, 4, 5],
        'B': [10, 20, 30, 40, 50]}
df = pd.DataFrame(data)

# Use apply() to apply a custom function to each column
df_applied = df.apply(lambda x: x * 2)
print(df_applied)
applymap() Function:
The applymap() function is used for element-wise operations on the entire DataFrame.
import pandas as pd

# Create a DataFrame
data = {'A': [1, 2, 3, 4, 5],
        'B': [10, 20, 30, 40, 50]}
df = pd.DataFrame(data)

# Use applymap() to apply a custom function to each element
df_mapped = df.applymap(lambda x: x * 2)
print(df_mapped)
Handling Outliers
Outliers are data points that significantly differ from the rest of the dataset and can distort the analysis results. Pandas provides robust methods like quantile(), clip(), and winsorize() to handle outliers effectively. By identifying and treating outliers properly, you can ensure that your analysis is based on reliable and accurate data.
quantile() Function:
The quantile() function in Pandas is used to compute the quantile of a Series or DataFrame. It returns the value at a specified quantile.
import pandas as pd

# Create a Series
data = [1, 2, 3, 4, 5]
series = pd.Series(data)

# Compute the 25th percentile (quantile)
q25 = series.quantile(0.25)
print("25th percentile (quantile):", q25)
clip() Function:
The clip() function is used to limit the values in a Series within an interval defined by a lower and upper bound.
import pandas as pd

# Create a Series
data = [1, 2, 3, 4, 5]
series = pd.Series(data)

# Clip the values to be within the range [2, 4]
clipped_series = series.clip(lower=2, upper=4)
print("Clipped Series:")
print(clipped_series)
winsorize() Function:
The winsorize() function is used to winsorize the values in a Series. Winsorizing involves replacing extreme values with values closer to the mean, based on a specified percentile.
import pandas as pd
from scipy.stats import winsorize

# Create a Series
data = [10, 20, 30, 40, 50, 100]
series = pd.Series(data)

# Winsorize the values to replace extreme values with values closer to the mean
winsorized_series = winsorize(series, limits=[0.1, 0.1])
print("Winsorized Series:")
print(winsorized_series)
By mastering data cleaning techniques with Pandas, you can ensure that your analysis is based on high-quality, reliable data, leading to more accurate insights and decisions.
Advanced Features of Pandas
As you delve deeper into the world of data analysis with Python, mastering the advanced features of Pandas becomes crucial. These features not only enhance your data manipulation and analysis skills but also provide you with the tools to tackle complex datasets effectively.
MultiIndexing
One of the powerful features of Pandas is MultiIndexing, which allows you to work with higher-dimensional data by creating hierarchical row and column indexes. This feature is particularly useful when dealing with multi-dimensional datasets or when you need to perform advanced data aggregation and grouping operations.
import pandas as pd

# Create a sample DataFrame with MultiIndex
index = pd.MultiIndex.from_tuples([('A', 1), ('A', 2), ('B', 1), ('B', 2)], names=['First', 'Second'])
columns = pd.MultiIndex.from_tuples([('X', 'a'), ('X', 'b'), ('Y', 'c')], names=['Type', 'Value'])
data = [[1, 2, 3], [4, 5, 6], [7, 8, 9], [10, 11, 12]]
df = pd.DataFrame(data, index=index, columns=columns)

# Display the DataFrame with MultiIndex
print("DataFrame with MultiIndex:")
print(df)

# Accessing data using MultiIndex
print("\nAccessing data using MultiIndex:")
print("Value at index ('A', 1) and column ('X', 'a'): ", df.loc[('A', 1), ('X', 'a')])
print("Values in the 'X' column: ")
print(df['X'])
Time Series Analysis
Pandas offers robust support for time series analysis, making it a preferred choice for handling temporal data. With built-in functionalities for resampling, shifting, and rolling window calculations, Pandas simplifies the process of analyzing time-based data and extracting meaningful insights from it.
import pandas as pd
import numpy as np

# Create a sample time series data
dates = pd.date_range('2022-01-01', periods=10)
ts_data = pd.Series(np.random.randn(10), index=dates)

# Display the time series data
print("Time Series Data:")
print(ts_data)
print()

# Resampling: Convert the frequency of the time series
resampled_data = ts_data.resample('M').mean()  # Resample to monthly frequency
print("Resampled Data (Monthly Mean):")
print(resampled_data)
print()

# Shifting: Shift the time series data by a specified number of periods
shifted_data = ts_data.shift(2)  # Shift the data by 2 periods
print("Shifted Data (2 Periods):")
print(shifted_data)
print()

# Rolling Window: Perform rolling window calculations (e.g., rolling mean)
rolling_mean = ts_data.rolling(window=3).mean()  # Calculate rolling mean with window size of 3
print("Rolling Window (3-period Mean):")
print(rolling_mean)
Data Visualization
While Pandas itself does not provide extensive data visualization capabilities, it integrates seamlessly with libraries like Matplotlib and Seaborn for creating insightful plots and visualizations. By leveraging the plotting functions in Pandas, you can generate informative charts, graphs, and histograms to better understand your data.
import pandas as pd
import numpy as np
import matplotlib.pyplot as plt

# Create a sample DataFrame
df = pd.DataFrame({
    'A': np.random.rand(50),
    'B': np.random.rand(50),
    'C': np.random.rand(50)
})

# Plot a scatter plot
df.plot(kind='scatter', x='A', y='B', title='Scatter Plot', color='blue')
plt.show()

# Plot a histogram
df['C'].plot(kind='hist', title='Histogram', bins=10, color='green')
plt.show()

# Plot a boxplot
df.plot(kind='box', title='Boxplot', color='red')
plt.show()
Use GroupBy and Aggregation Functions
The groupby() function in Pandas allows you to group data based on one or more variables and perform aggregate operations on these groups. By combining groupby() with aggregation functions like sum(), mean(), count(), and std(), you can generate valuable insights from your data. Grouping data and calculating summary statistics can help you identify patterns and trends within your dataset.
import pandas as pd

# Create a sample DataFrame
data = {
    'Category': ['A', 'A', 'B', 'B', 'A', 'B', 'A', 'B'],
    'Value': [10, 20, 30, 40, 50, 60, 70, 80]
}
df = pd.DataFrame(data)

# Grouping by 'Category' and calculating aggregate statistics
grouped_df = df.groupby('Category').agg({
    'Value': ['sum', 'mean', 'count', 'std']
})

print("Aggregate statistics by category:")
print(grouped_df)
Merging and Joining Data
When working with multiple datasets, Pandas provides powerful methods for merging and joining data based on common columns or indices. Whether you need to combine data horizontally or vertically, Pandas offers flexible options like merge(), join(), and concat() to efficiently merge datasets and create a unified view of the data.
import pandas as pd

# Create sample DataFrames
df1 = pd.DataFrame({'ID': [1, 2, 3],
                    'Name': ['Alice', 'Bob', 'Charlie']})

df2 = pd.DataFrame({'ID': [2, 3, 4],
                    'Age': [25, 30, 35]})

# Merge DataFrames based on a common column 'ID'
merged_df = pd.merge(df1, df2, on='ID', how='inner')

# Join DataFrames based on index
df3 = pd.DataFrame({'Score': [85, 90, 95]}, index=[1, 2, 3])
joined_df = df1.join(df3, how='left')

# Concatenate DataFrames vertically
concatenated_df = pd.concat([df1, df2], axis=0)

print("Merged DataFrame:")
print(merged_df)

print("\nJoined DataFrame:")
print(joined_df)

print("\nConcatenated DataFrame:")
print(concatenated_df)
Use Vectorized Operations
One of the key advantages of Pandas is its ability to perform vectorized operations, which can significantly improve performance when working with large datasets. Instead of iterating over each element in a DataFrame, try to leverage built-in functions and operations that can be applied to entire columns or rows at once. This approach not only speeds up processing but also simplifies your code and makes it more readable.
import pandas as pd
import numpy as np

# Create a sample DataFrame
df = pd.DataFrame({
    'A': np.random.randint(1, 100, 5),
    'B': np.random.randint(1, 100, 5),
    'C': np.random.randint(1, 100, 5)
})

# Display the original DataFrame
print("Original DataFrame:")
print(df)
print()

# Vectorized operations: Add 10 to each element in column 'A'
df['A'] = df['A'] + 10

# Vectorized operations: Multiply each element in column 'B' by 2
df['B'] = df['B'] * 2

# Vectorized operations: Take square root of each element in column 'C'
df['C'] = np.sqrt(df['C'])

# Display the modified DataFrame after vectorized operations
print("DataFrame after vectorized operations:")
print(df)
Optimize Memory Usage
When working with massive datasets, memory usage can become a critical factor in the performance of your code. To optimize memory usage in Pandas, consider using data types that require less memory, such as integers instead of floats or category data types for categorical variables. Additionally, you can use methods like the reduce_memory_usage() function to reduce the memory footprint of your DataFrames.
import pandas as pd

# Create a sample DataFrame with mixed data types
data = {
    'A': [1, 2, 3, 4],
    'B': [1.1, 2.2, 3.3, 4.4],
    'C': ['a', 'b', 'c', 'd']
}
df = pd.DataFrame(data)

# Display memory usage before optimization
print("Memory usage before optimization:")
print(df.memory_usage(deep=True))

# Convert float columns to integers if possible
int_cols = df.select_dtypes(include=['float']).apply(pd.to_numeric, downcast='integer')
df[int_cols.columns] = int_cols

# Convert object columns to category data type
obj_cols = df.select_dtypes(include=['object'])
for col in obj_cols.columns:
    df[col] = df[col].astype('category')

# Display memory usage after optimization
print("\nMemory usage after optimization:")
print(df.memory_usage(deep=True))
Handling Big Data
For handling large datasets that do not fit into memory, Pandas offers support for out-of-core computation through tools like Dask and Modin. These tools allow you to perform parallel and distributed processing on massive datasets, enabling you to work with big data efficiently using Pandas.
By mastering these advanced features of Pandas, you can elevate your Python skills for data analysis to a higher level and confidently tackle complex data analysis tasks with efficiency and precision.
Visualizing Data with Pandas
Visualizing data is a crucial aspect of data analysis, as it allows us to gain insights and make informed decisions based on the patterns and trends present in the data. Pandas, along with its integration with libraries like Matplotlib and Seaborn, provides powerful tools for data visualization.
Benefits of Data Visualization with Pandas
Visualizing data with Pandas offers several benefits for data analysis tasks. It helps in understanding the distribution of data, identifying outliers, detecting trends, and communicating insights effectively. By leveraging the visualization capabilities of Pandas, Python programmers can create informative plots and charts to explore and analyze complex datasets.
Creating Plots and Charts
With Pandas, you can easily create a variety of plots and charts to visualize your data. Some of the common types of plots that can be generated using Pandas include histograms, bar plots, line plots, scatter plots, box plots, and more. These plots provide a visual representation of the data, making it easier to interpret and analyze.
- Histograms: Histograms are useful for visualizing the distribution of numerical data.
- Bar plots: Bar plots are effective for comparing categorical data.
- Line plots: Line plots are ideal for showing trends over time.
- Scatter plots: Scatter plots help in identifying relationships between two variables.
- Box plots: Box plots display the distribution and variability of the data.
Utilize Pandas' Built-in Plotting Functions
Pandas integrates with visualization libraries like Matplotlib and Seaborn to provide built-in plotting functions for DataFrames. By using these functions, you can create a wide variety of plots and charts directly from your data, helping you visualize trends, relationships, and distributions. Experimenting with different plot types can enhance your data exploration and presentation capabilities.
Interpreting Plots and Charts
Interpreting plots and charts generated with Pandas is essential for extracting meaningful insights from the data. By analyzing the patterns, trends, and relationships depicted in the visualizations, you can draw conclusions, make predictions, and guide decision-making processes. Understanding how to interpret different types of plots enables you to effectively communicate the findings to stakeholders and make data-driven decisions.
Conclusion and Further Learning
As we conclude our exploration of Pandas and its advanced features for data analysis in Python, it is evident that mastering this powerful library can significantly enhance your Python skills and open up new opportunities for exploring and understanding complex datasets. By leveraging the wide range of functions and methods available in Pandas, you can efficiently manipulate, analyze, and visualize data, making it a valuable tool for data professionals across various industries.
Continuing Your Learning Journey
If you are looking to further enhance your Python skills with Pandas, there are several avenues for continuing your learning journey. You can explore more advanced topics in Pandas such as multi-indexing, time series analysis, data visualization, and groupby operations to deepen your understanding of data manipulation and analysis techniques.
Explore the World of Data Analysis with Pandas
Whether you are a beginner looking to enhance your Python skills or an experienced data professional seeking to deepen your knowledge of data analysis, Pandas is a versatile and powerful tool that can help you achieve your goals. By diving into the world of Pandas functions, data cleaning techniques, and advanced features, you can unlock new possibilities for exploring and understanding data in a meaningful and insightful way.
Remember to practice regularly, experiment with different datasets, and stay curious about the various functionalities of Pandas. With dedication and perseverance, you can master Pandas and become a proficient data analyst capable of handling a wide range of data analysis tasks with precision and efficiency.
FAQ's
- What is the use of pandas?
Pandas is a Python library used for data manipulation and analysis. It provides data structures like DataFrame and Series, along with functions for reading and writing data from various file formats, cleaning and preprocessing data, and performing complex data operations like merging, joining, and grouping. - What is NumPy and pandas in Python?
NumPy and pandas are both popular Python libraries used for data manipulation and analysis. NumPy provides support for multidimensional arrays & mathematical functions to operate on these arrays efficiently. Pandas, on the other hand, builds upon NumPy and provides additional data structures and functions specifically tailored for data analysis tasks, such as DataFrame and Series. - Is pandas written in C?
Yes, certain performance-critical parts of pandas, particularly those involving numerical computations, are written in C to ensure efficiency and speed. - What is the difference between NumPy and pandas?
- NumPy focuses on providing support for multidimensional arrays and mathematical functions to operate on these arrays efficiently.
- Pandas builds upon NumPy and provides additional data structures like DataFrame and Series, along with functions for data manipulation and analysis, making it more suitable for data analysis tasks.
- What are the two main data types in pandas?
The two main data types in pandas are:- Series: a one-dimensional labeled array capable of holding data of any type
- DataFrame: a two-dimensional labeled data structure with columns of potentially different types, similar to a spreadsheet or SQL table
- Who developed Python pandas?
Wes McKinney initially developed pandas while working at AQR Capital Management in 2008. It was later open-sourced and has since been maintained by a community of contributors. - What is pandas DataFrame for?
Pandas DataFrame is used for tabular data representation and manipulation. It provides a two-dimensional labeled data structure with columns of potentially different data types, similar to a spreadsheet or SQL table. DataFrames offer powerful methods for data manipulation, cleaning, analysis, and visualization. - How do you create a DataFrame?
You can create a DataFrame using thepd.DataFrame()constructor by passing a dictionary, a list of dictionaries, or a NumPy array as input. - What is the purpose of pandas?
The purpose of pandas is to provide powerful and flexible tools for data manipulation and analysis in Python. It simplifies the process of cleaning, preprocessing, and analyzing data, making it easier for data scientists, analysts, and developers to work with structured data effectively. - What are advantages of pandas?
Some advantages of pandas include:- Easy handling of missing data
- Powerful tools for data cleaning and preprocessing
- Flexible data manipulation and reshaping capabilities
- Integration with other Python libraries for data analysis and visualization
- Efficient performance, especially for large datasets